TryHackMe: Volatility
This is a write up for the Volatility room on TryHackMe. Some tasks have been omitted as they do not require an answer.
First, let’s figure out what profile we need to use. Profiles determine how Volatility treats our memory image since every version of Windows is a little bit different. Let’s see our options now with the command volatility -f MEMORY_FILE.raw imageinfo
volatility -f cridex.vmem imageinfo
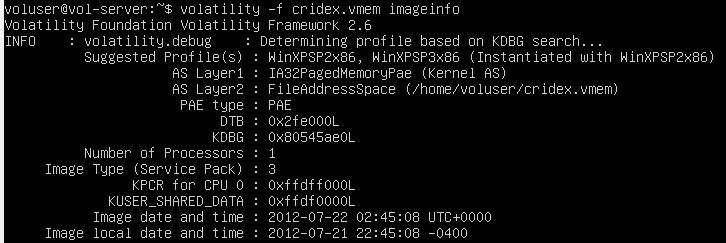
Running the imageinfo command in Volatility will provide us with a number of profiles we can test with, however, only one will be correct. We can test these profiles using the pslist command, validating our profile selection by the sheer number of returned results. Do this now with the command volatility -f MEMORY_FILE.raw --profile=PROFILE pslist. What profile is correct for this memory image?
In the output above, volatility has suggested a profile to try: WinXPSP2x86
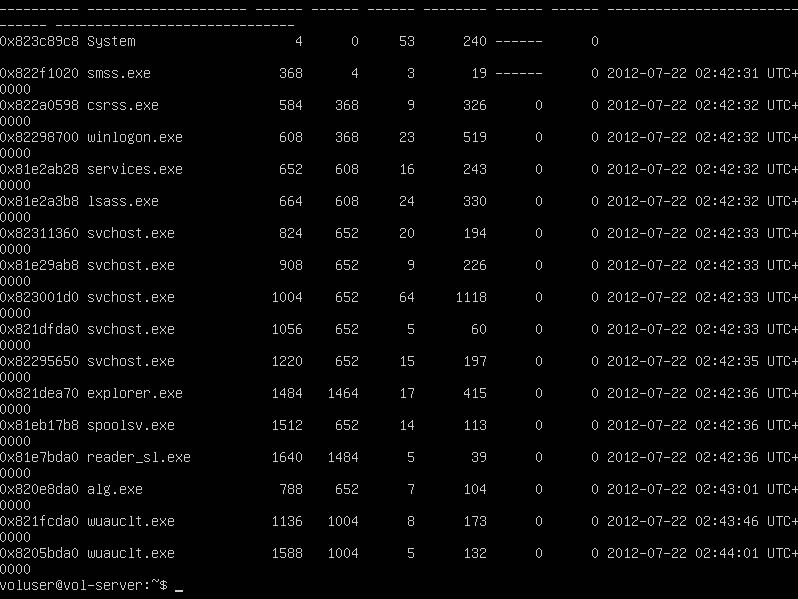
volatility -f cridex.vmem --profile=WinXPSP2x86 pslist
Answer: WinXPSP2x86
Take a look through the processes within our image. What is the process ID for the smss.exe process? If results are scrolling off-screen, try piping your output into less

Answer: 368
In addition to viewing active processes, we can also view active network connections at the time of image creation! Let’s do this now with the command volatility -f MEMORY_FILE.raw --profile=PROFILE netscan. Unfortunately, something not great is going to happen here due to the sheer age of the target operating system as the command netscan doesn’t support it.
volatility -f cridex.vmem --profile=WinXPSP2x86 netscan

It’s fairly common for malware to attempt to hide itself and the process associated with it. That being said, we can view intentionally hidden processes via the command psxview. What process has only one ‘False’ listed?
volatility -f cridex.vmem --profile=WinXPSP2x86 psxview
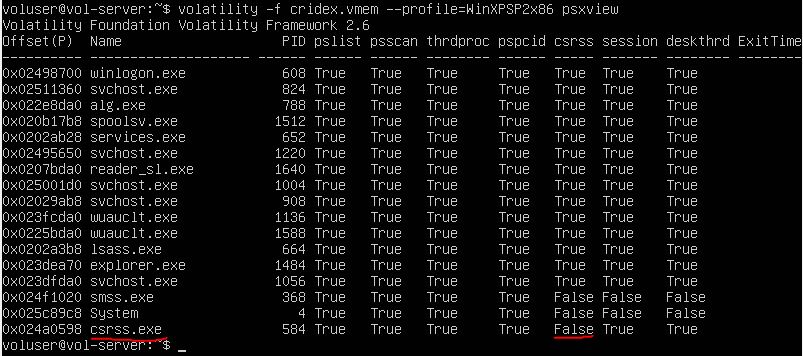
Answer: csrss.exe
In addition to viewing hidden processes via psxview, we can also check this with a greater focus via the command ‘ldrmodules’. Three columns will appear here in the middle, InLoad, InInit, InMem. If any of these are false, that module has likely been injected which is a really bad thing. On a normal system the grep statement above should return no output. Which process has all three columns listed as ‘False’ (other than System)?
This output is going to be very large, so lets output it to a text file.
volatility -f cridex.vmem --profile=WinXPSP2x86 ldrmodules > output.txt
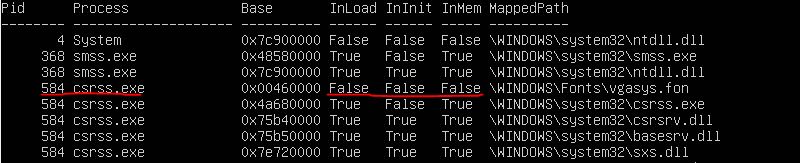
Answer: csrss.exe
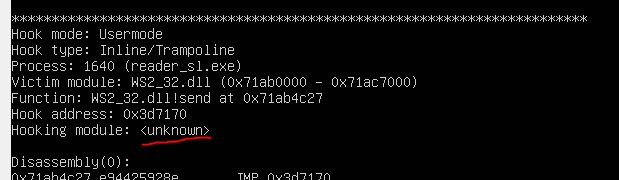
Processes aren’t the only area we’re concerned with when we’re examining a machine. Using the ‘apihooks’ command we can view unexpected patches in the standard system DLLs. If we see an instance where Hooking module: that's really bad. This command will take a while to run, however, it will show you all of the extraneous code introduced by the malware.
volatility -f cridex.vmem --profile=WinXPSP2x86 apihooks
Injected code can be a huge issue and is highly indicative of very very bad things. We can check for this with the command malfind. Using the full command volatility -f MEMORY_FILE.raw --profile=PROFILE malfind -D <Destination Directory> we can not only find this code, but also dump it to our specified directory. Let’s do this now! We’ll use this dump later for more analysis. How many files does this generate?
volatility -f cridex.vmem --profile=WinXPSP2x86 malfind -D /tmp
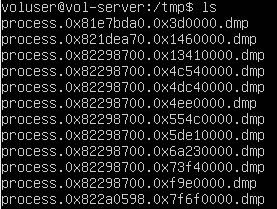
Answer: 12
Last but certainly not least we can view all of the DLLs loaded into memory. DLLs are shared system libraries utilized in system processes. These are commonly subjected to hijacking and other side-loading attacks, making them a key target for forensics. Let’s list all of the DLLs in memory now with the command dlllist
volatility -f cridex.vmem --profile=WinXPSP2x86 dlllist
Now that we’ve seen all of the DLLs running in memory, let’s go a step further and pull them out! Do this now with the command volatility -f MEMORY_FILE.raw --profile=PROFILE --pid=PID dlldump -D <Destination Directory> where the PID is the process ID of the infected process we identified earlier (questions five and six). How many DLLs does this end up pulling?
volatility -f cridex.vmem --profile=PROWinXPSP2x86FILE --pid=584 dlldump -D /tmp
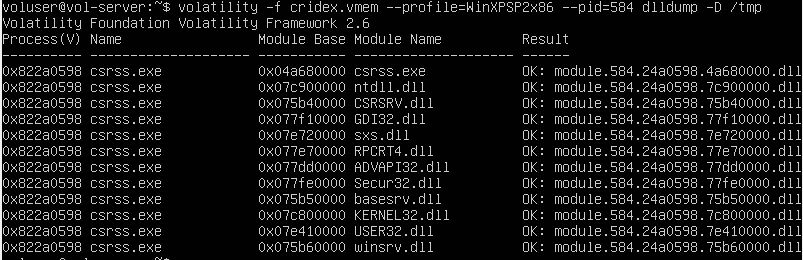
Answer: 12
Recap
In this task we learnt how to:
- Use Volatility to conduct memory forensics and identfy the Cridex malware